
Nifty Max Pain Today: What It Means for Options Traders
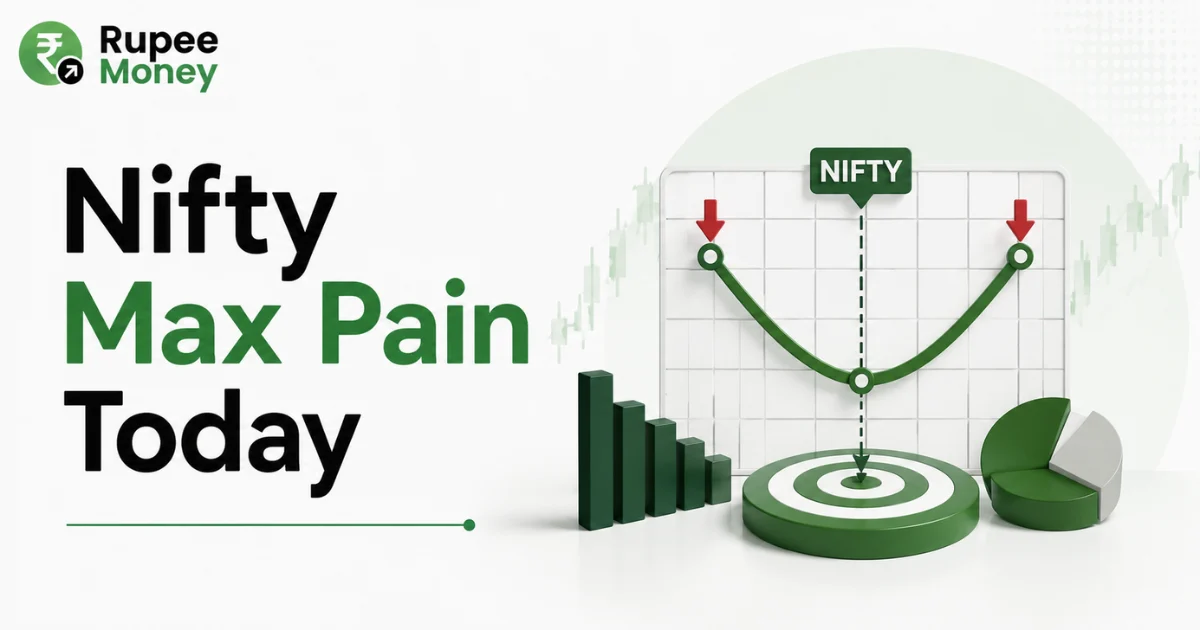
For active participants in the Indian derivatives market, tracking weekly and monthly options expiry can often feel like navigating a storm of shifting numbers, volatile swings, and heavy open interest build-ups. Welcome to RupeeMoney, your comprehensive guide to smart trading and financial literacy. Among the many quantitative metrics used by market participants on Dalal Street, Nifty 50 max pain is one of the most widely followed data points. It seeks to identify the exact strike price where the combined financial payout of all outstanding call and put options would be minimal at the time of expiry.
When trading index derivatives, keeping track of Nifty max pain live data provides actionable context regarding institutional positioning and sentiment. However, a major question remains: is max pain a self-fulfilling prophecy, a mathematical magnet for the index, or simply an analytical snapshot of where option writers stand?
Whether you are an intraday scalper or a positional trader, understanding the mechanics behind the max pain of Nifty is essential. In this detailed guide, we break down what max pain is, how it is calculated, how to read a max pain chart, and how you can combine this indicator with price action to refine your trading strategy.
What Is Nifty 50 Max Pain?
In derivatives trading, Nifty 50 max pain refers to the specific strike price at which option buyers (both call and put holders) collectively experience the maximum theoretical financial loss. Viewed from the opposite side of the trade, it represents the strike price where option sellers (often referred to as option writers or institutional market makers) face the lowest aggregate payout at contract expiry.
The underlying theory assumes that option sellers—who generally deploy larger amounts of capital and carry unlimited risk—have a vested interest in seeing the underlying index settle at a price where the maximum number of options expire worthless (out-of-the-money). If the Nifty 50 index expires exactly at the max pain strike, the total intrinsic value paid out across all open call and put contracts is at its absolute minimum.
Total Option Buyer Loss (Maximized) = Total Option Writer Payout (Minimized) = Max Pain Strike
Why Is Max Pain Important?
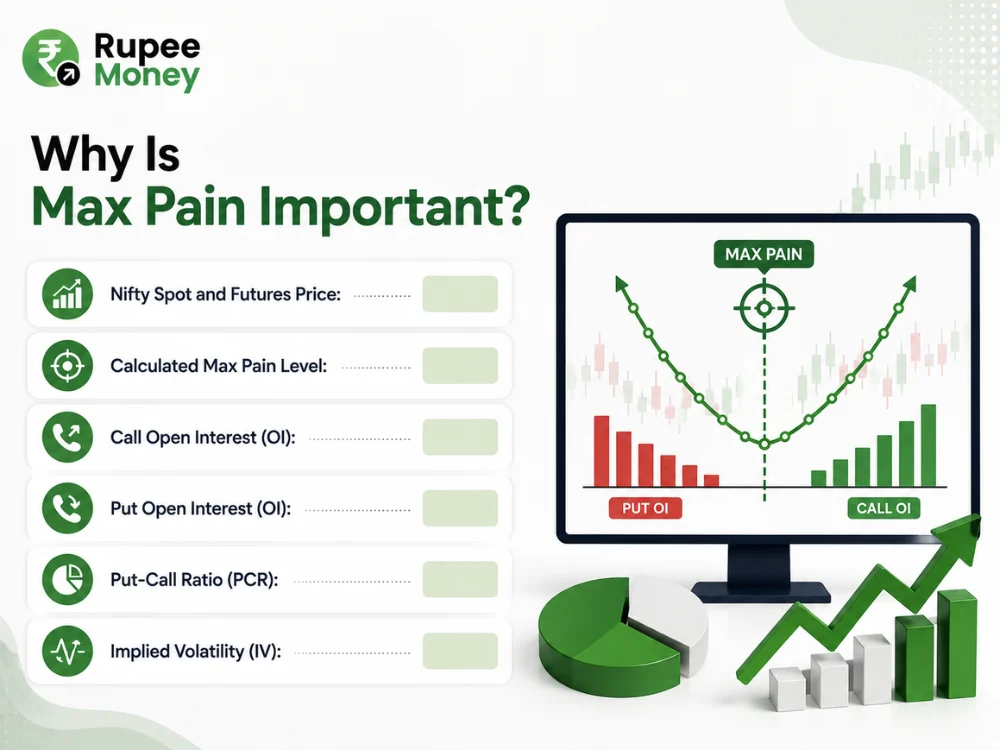
Monitoring the max pain level provides traders with a structural map of the market’s current open interest distribution. Rather than looking at individual strikes in isolation, max pain aggregates the entire option chain into a single focal point.
When approaching an expiry session, professional traders frequently evaluate:
- Nifty Spot and Futures Price: The prevailing real-time market price.
- Calculated Max Pain Level: The theoretical minimum-payout strike.
- Call Open Interest (OI): High concentrations that often indicate overhead resistance.
- Put Open Interest (OI): Heavy concentrations that highlight downside support.
- Put-Call Ratio (PCR): The overall balance between bullish and bearish positioning.
- Implied Volatility (IV): The market’s expectation of upcoming price swings.
Understanding these components helps traders manage risk effectively, particularly when managing complex spreads or trading index options on expiry day.
How Is Nifty Max Pain Calculated?
The mathematical calculation of Nifty 50 max pain relies entirely on the open interest (OI) of call and put options across every actively traded strike price for a chosen expiry cycle.
The formula systematically evaluates what the total financial loss for option writers (or cumulative payout to buyers) would be if the Nifty index were to settle at every individual strike price available in the option chain.
Total Payout at Strike KK = ∑(Call Payouts)+∑(Put Payouts)\Where:
○ Call Payout: max(0,S−Kcall)×Call OI (where SS is the assumed settlement price)
○ Put Payout: max(0,Kput−S)×Put OI
How Does the Calculation Work?
To see this formula in action, imagine a simplified Nifty option chain with open interest distributed across three key strikes: 24,200, 24,300, and 24,400.
| Assumed Expiry Settlement | Cumulative Call Option Payout | Cumulative Put Option Payout | Total Combined Payout |
| At 24,200 | Low (Most Calls Expire OTM) | Very High (Puts at 24,300 & 24,400 ITM) | High Payout |
| At 24,300 | Moderate (24,200 Calls ITM) | Moderate (24,400 Puts ITM) | Lowest Combined Payout (Max Pain) |
| At 24,400 | Very High (24,200 & 24,300 Calls ITM) | Low (Most Puts Expire OTM) | High Payout |
In this illustrative scenario, a settlement at 24,300 results in the lowest cumulative dollar value paid out to option buyers. Consequently, 24,300 is declared the max pain strike. In the live market, this calculation is performed across dozens of strikes simultaneously.
Why Does Nifty Max Pain Change?
A common misconception among beginner traders is that the max pain level is a static number calculated once and fixed until expiry. In reality, the max pain of Nifty is dynamic and can shift continuously throughout the trading week.
Open Interest Changes
During live market hours, market participants continuously execute new trades. An aggressive build-up of fresh call writing at higher levels or heavy put writing at lower levels alters the cumulative payout math, causing the max pain strike to shift upward or downward.
Position Unwinding and New Expiry
When institutional traders exit or square off their positions due to unexpected macroeconomic news, open interest declines sharply. Furthermore, as one contract cycle concludes and traders roll their exposure into the subsequent weekly or monthly expiry, the new option chain establishes an entirely distinct max pain baseline.
What Is Nifty Max Pain Live?
Nifty max pain live refers to real-time or frequently refreshed max pain data generated by quantitative trading terminals and broker analytics dashboards. Because open interest updates every few minutes from exchange data feeds, live tracking allows traders to spot institutional adjustments as they happen.
However, traders must exercise caution when comparing live data across multiple platforms. Different market analytics tools may display slightly different numbers based on:
- Timestamp Differences: Whether the feed updates every 3 minutes or at 15-minute delayed snapshots.
- Strike Selection Depth: Some algorithms calculate max pain using all available strikes, while others restrict the calculation to strikes within 1,000$ points of the current spot price.
- Expiry Selection: Selecting the current weekly expiry versus the monthly contract.
How Do You Read a Nifty Max Pain Chart?
A max pain chart visualizes the cumulative financial loss curve across various strike prices on an X-Y axis. The lowest point (the trough of the curve) represents the strike price with the minimum payout.
When reading a max pain chart, traders typically compare the location of the trough relative to the current Nifty spot price:
What If Nifty Is Near Max Pain?
When the spot Nifty price is trading within 20 to 50 points of the max pain level as the expiry session progresses, it often points to a range-bound, low-volatility environment. In such scenarios, option sellers often look to capitalize on theta decay (time decay) as both calls and puts lose value.
What If Nifty Is Far From Max Pain?
When spot Nifty trades 150 to 300 points away from the max pain strike, an imbalance exists between current price momentum and historical open interest build-up. This indicates that either:
- Strong trending momentum (driven by foreign institutional flows or major corporate results) is overpowering option writers, or
- Option writers may soon be forced to cover their positions (short covering or long unwinding), which can trigger a rapid move in the index.
Why Do Options Traders Watch Nifty Max Pain?
Derivatives traders do not view max pain as a magic crystal ball, but rather as an essential sentiment and risk-management gauge. Mastering its application is a standard part of navigating futures vs options trading.
- Identifying Expiry Magnets: In the absence of major economic triggers, the index often consolidates near high open-interest clusters due to heavy institutional hedging.
- Structuring Non-Directional Strategies: Traders who deploy market-neutral strategies—such as Short Straddles, Iron Condors, or Short Strangles—frequently center their positions around the max pain strike to maximize time decay.
- Detecting Trapped Writers: If Nifty breaches a major open interest strike with rising volume, it signals that option sellers are under pressure, warning directional traders against fighting the trend.
Where Should You Use Nifty Max Pain in Options Analysis?
Max pain should never be used as an isolated metric. Instead, it must be integrated into a multi-layered derivatives analysis framework. A reliable analytical sequence follows this flow:
Nifty Spot Price → Max Pain Level → Call & Put OI Clusters → Change in OI→ Put-Call Ratio (PCR) → Price Action
For instance, if Nifty is trading at 24,150 while the max pain level sits at 24,300:
- Check PCR: Is the Put-Call Ratio below 0.75 (oversold) or above 1.30 (overbought)?
- Examine Change in OI: Are put writers adding aggressive fresh positions at 24,100 and 24,200 to push the index higher?
- Confirm with Technical Charts: Is the 15-minute price action making higher highs and breaking local resistance?
If these factors align, the probability of the index drifting upward toward the max pain zone increases significantly.
What Is the Difference Between Max Pain and Support or Resistance?
It is vital to distinguish between mathematical derivatives indicators and price-based technical analysis levels.
| Feature | Nifty 50 Max Pain | Technical Support & Resistance |
| Primary Data Source | Call and Put Open Interest (OI) | Historical Price Action, Volumes, and Pivot Points |
| Time Horizon | Expiry-specific (Weekly/Monthly) | Multi-timeframe (Daily, Hourly, 5-Min Charts) |
| Dynamic Nature | Shifts as open interest positions change | Static until broken by price |
| Market Meaning | Theoretical lowest payout for option writers | Price levels where buying or selling interest emerges |
A max pain strike might occasionally align with a technical horizontal support or resistance level, but they are derived from completely different market dynamics.
Can Nifty Max Pain Predict the Closing Price?
The short answer is no. Max pain cannot reliably predict the exact closing price of the Nifty 50 index.
While the theory holds well during quiet, consolidation-heavy trading weeks, unexpected real-world catalysts can override option positioning in minutes. Market direction is heavily driven by broader macro variables, including:
- Institutional buying and selling by Foreign Institutional Investors (FIIs) and Domestic Institutional Investors (DIIs).
- Global equity market cues and geopolitical developments.
- Sudden shifts in domestic monetary policy or interest rate announcements by the RBI.
- Sharper intraday swings and volatility spikes, highlighting what makes the stock market go up or down.
During strong trending days, option sellers are frequently caught on the wrong side, resulting in massive short-covering rallies or rapid market sell-offs that leave the theoretical max pain level far behind.
How Can Beginners Use Nifty Max Pain?
If you are new to derivatives and learning the basics through a structured stock market India guide, avoid taking direct buy or sell positions based solely on the max pain number. Instead, follow this structured routine:
Step 1: Confirm the active weekly expiry date.
Step 2: Note the current Nifty Spot price and its distance from Max Pain.
Step 3: Identify the highest Call OI strike (Resistance) and highest Put OI strike (Support).
Step 4: Observe “Change in OI” to see where institutional money is moving.
Step 5: Validate the setup using simple technical analysis tools (moving averages, VWAP).
By following this step-by-step approach, beginners can avoid false breakouts and gain a clearer understanding of institutional derivatives activity.
Why Should You Not Trade Only Based on Nifty Max Pain?
Trading solely on max pain is one of the most common pitfalls for retail traders. Believing that “the market must close at max pain” ignores the reality of dynamic market liquidity.
When market momentum is strong, option writers do not simply hold their losing positions until expiry—they cut losses, hedge with index futures, or roll their strikes. This defensive unwinding rapidly changes the option chain math, causing the max pain level to move toward the market price rather than the market moving toward max pain.
Treating max pain as a supporting indicator rather than a guaranteed target is key to preventing major drawdowns during intraday trading.
Nifty Max Pain Today: What Should Traders Check?
When analyzing Nifty max pain live during an active trading session, always verify the broader context:
- Compare Multiple Expiries: Check both the immediate weekly contract and the monthly contract to determine whether short-term positioning aligns with the broader monthly trend.
- Monitor the Shift in the Max Pain Strike: If max pain was at 24,200 in the morning and migrates upward to 24,350 by mid-day, it indicates aggressive bullish positioning across the option chain.
- Track Index Volatility: Check the India VIX. When market volatility surges, theoretical models become less reliable, making strict stop-loss discipline critical to managing stock volatility.
What Are the Limitations of the Nifty Max Pain Theory?
To use any trading indicator effectively, you must understand where it fails. The limitations of the max pain theory include:
- Lagging Data: Open interest data updates at intervals throughout the day. In fast-moving markets, price action will always lead, while open interest metrics lag behind.
- Incomplete Intent Visibility: Open interest shows the total number of open contracts, but it does not reveal whether positions belong to retail buyers, proprietary desks, or hedged institutional portfolios.
- Irrelevance in Trending Markets: When the market enters a strong breakout phase driven by major macro events, max pain theory often breaks down completely as option writers are forced to exit.
Conclusion: How Should Options Traders Use Nifty Max Pain?
The max pain of Nifty provides a unique window into the financial battleground between option buyers and option sellers. By identifying the strike price with the theoretical minimum payout, traders can better understand where institutional market participants are positioned as expiry approaches.
However, trading success lies in synthesis. A max pain chart or a Nifty max pain live tracker should never replace sound technical analysis, trend identification, and strict risk management. By combining the Nifty 50 max pain strike with open interest analysis, the Put-Call Ratio, and broader market price action, you can build a more resilient and structured approach to the derivatives market. Explore more analytical tools and trading guides on RupeeMoney to keep your market journey informed and profitable.
FAQs
What is Nifty 50 Max Pain?
Nifty 50 max pain is the strike price where option writers face the least combined financial payout and option buyers experience the highest collective loss upon contract expiry.
How is the max pain of Nifty calculated?
It is calculated by determining the cumulative intrinsic value of all open call and put options at every possible strike price. The strike that produces the lowest total payout across all strikes is identified as the max pain point.
What does a Nifty Max Pain Chart show?
A max pain chart plots the total potential payout against different strike prices, visually highlighting the lowest point of the curve where option-holder payouts are minimized.
Does Nifty always expire at max pain?
No. Nifty frequently closes away from the max pain level, especially when trending momentum, institutional cash flows, or major news events force option sellers to cover their positions.
Can beginners rely on Nifty max pain live data for intraday trades?
Beginners should use live max pain data only as a secondary confirmation tool alongside price action, volume, and support-resistance levels, rather than as a standalone trade trigger.
Nifty 50 max pain is the strike price where option writers face the least combined financial payout and option buyers experience the highest collective loss upon contract expiry.
A max pain chart plots the total potential payout against different strike prices, visually highlighting the lowest point of the curve where option-holder payouts are minimized.
Disclaimer: This article is published solely for educational and informational purposes only. Does not constitute financial, investment, or derivatives trading advice. Options trading involves substantial financial risk and can lead to capital loss. Always conduct independent research and consult a SEBI-registered financial advisor before entering into derivatives contracts.
ABOUT THE AUTHOR

