
What Is the Morning Star Candlestick Pattern? A Complete Guide

Traders constantly look for signs that a falling market might turn around. The morning star candlestick serves as one of the most popular indicators for this exact scenario. This three-candle bullish reversal pattern helps traders spot when selling pressure weakens. It shows exactly when buyers begin to take control of the market.
Understanding a morning star chart gives you a distinct trading advantage. It visually explains the sudden shift in market momentum. However, you should never treat this pattern as a guaranteed signal. Markets remain unpredictable.
In this comprehensive stock market India guide, we will explore the star morning formation. You will learn how it develops, where it appears, and how you can confirm it. Mastering this specific pattern will help you read price charts more effectively and improve your daily trading decisions.
What Is the Morning Star Candlestick Pattern?
The morning star candlestick is a powerful bullish reversal formation. It typically appears right at the end of a long downtrend.
The pattern contains three specific candles:
- First candle: A large bearish candle.
- Second candle: A small-bodied candle showing market uncertainty.
- Third candle: A strong bullish candle.
The first candle shows that sellers still control the market. The small middle candle suggests the selling momentum is fading rapidly. Finally, the third candle proves that buyers have returned with massive force. Together, these three candles highlight a major shift from bearish panic to bullish optimism. Understanding this shift helps you grasp exactly what makes the stock market go up or down.
Why Do Traders Call It a Morning Star?
The name derives from the visual concept of a star appearing just before a bright sunrise. In traditional technical analysis, this pattern represents the dawn of a new upward trend after a dark period of declining prices. This hopeful symbolism explains why traders classify the star morning as a premier bullish reversal pattern.
What Does a Morning Star Chart Look Like?
A morning star chart displays these three candles forming near the bottom of a downtrend. You can visualize the structure easily:
Large Bearish Candle → Small Middle Candle → Large Bullish Candle
The middle candle acts as the critical transition point. It separates the aggressive selling of the first day from the aggressive buying of the third day.
However, real-world charts rarely look perfect. The size of the gaps between these candles varies. Timeframes, market volatility, and liquidity all change how the final pattern looks on your screen. You must train your eyes to spot the core psychology behind the candles rather than looking for a textbook drawing.
How Does the Star Morning Formation Develop?
The pattern develops purely through a shift in the balance of power between buyers and sellers. Let us break down the psychology behind each step.
How Does the First Candle Form?
The first candle forms as a large, solid bearish candle. Sellers push prices significantly lower during this trading session. The larger the red body, the stronger the selling pressure appears. The market feels extremely negative at this point.
What Happens During the Second Candle?
The second candle prints a very small real body. It can close bullish or bearish. Sometimes, it forms a perfect doji. This small body proves that neither buyers nor sellers hold clear control. The downward momentum has hit a wall. This candle represents pure market exhaustion and uncertainty.
Why Is the Third Candle Crucial?
The third candle forms as a massive bullish green candle. Buyers aggressively enter the market and push prices higher. To confirm a strong morning star candlestick, this third candle must close deep into the body of the first bearish candle. This aggressive upward thrust proves the buyers have successfully taken charge.
How to Identify a Morning Star Candlestick in Live Markets?
Spotting a morning star candlestick requires close attention to detail. You must examine several specific characteristics before executing a trade on the NSE vs BSE.
How Do You Identify the First Candle?
You must look for a strong bearish candle. Crucially, this candle must appear within an established downtrend. If the market is moving sideways, ignore the pattern. The first candle must prove that sellers recently dominated the price action.
What Should the Second Candle Look Like?
You must check the middle candle for a small real body. Compare it directly to the massive first candle. It might look like a small bullish candle, a small bearish candle, or a doji. The exact color does not matter. The small size matters. It confirms market hesitation.
What Should the Third Candle Show?
You must wait for a strong bullish third candle. The best setups occur when this third candle closes above the midpoint of the first bearish candle. The deeper this green candle penetrates the first red candle, the more powerful the reversal signal becomes.
Where Does the Star Morning Chart Pattern Usually Appear?
Location dictates the success rate of any chart pattern. A star morning chart formation holds much more weight when it appears after a sustained market crash.
Why Does the Trend Matter?
You must always interpret candlestick patterns within the broader market context. If a stock falls for ten straight days, a morning star candlestick signals that the selling pressure is finally dying.
If the same three candles appear in a choppy, sideways market, they mean almost nothing. Without a prior downtrend, you cannot have a bullish reversal. Therefore, you must always verify the current trend before analyzing the specific candles.
What Does the Morning Star Pattern Tell Traders?
This pattern clearly communicates a massive change in market psychology.
- The first candle screams seller dominance.
- The second candle whispers market uncertainty.
- The third candle shouts buyer dominance.
This specific sequence tells you the bears have lost their strength. However, it never guarantees a permanent market bottom. Smart traders use it as a warning sign to prepare for a new long position.
Why Is Confirmation Important After a Morning Star?
A morning star chart offers a clue, not a guaranteed prediction. Professional traders always wait for extra confirmation before risking their capital.
What Can Confirm the Pattern?
You can confirm the pattern using several methods:
- A surge in trading volume on the third day.
- A clean break above a nearby resistance level.
- The creation of a higher high in the next trading session.
- Positive signals from momentum indicators like RSI or MACD.
- The pattern forming directly on a major historical support zone.
If the pattern forms on a strong support level and the next candle breaks resistance, your trade carries a much higher probability of success. Never risk your money based solely on three candles.
How Can Volume Strengthen a Morning Star Chart?
Volume adds incredible context to your price charts. You should always check the volume bars when trading a star morning chart.
Imagine the third bullish candle forms with massive trading volume. This high volume proves that large institutional buyers are driving the price higher. It validates the reversal.
Conversely, if the third candle forms on very low volume, you should stay cautious. Low volume indicates a lack of real buying interest. The market might simply be experiencing a temporary dead-cat bounce. Reading volume correctly saves you from entering weak trades.
What Is the Difference Between Morning Star and Evening Star?
The morning star and the evening star represent exact opposites in technical analysis.
| Feature | Morning Star | Evening Star |
| Market Context | Appears in a Downtrend | Appears in an Uptrend |
| Potential Signal | Bullish Reversal | Bearish Reversal |
| First Candle | Large Bearish Candle | Large Bullish Candle |
| Middle Candle | Small Body (Indecision) | Small Body (Indecision) |
| Third Candle | Large Bullish Candle | Large Bearish Candle |
| Expected Direction | Moves Upward | Moves Downward |
The morning star tells you to prepare for a buying opportunity. The evening star tells you to prepare for a selling opportunity.
How Is the Morning Star Different From a Doji?
Many beginners confuse these two terms. A doji is a single candlestick. It forms when the opening price and closing price are nearly identical.
A morning star candlestick is a complex three-candle pattern. The middle candle of a morning star can indeed be a doji. However, a single doji standing alone does not make a morning star. You need the strong bearish candle before it and the strong bullish candle after it to complete the formation.
When Should Traders Use the Morning Star Pattern?
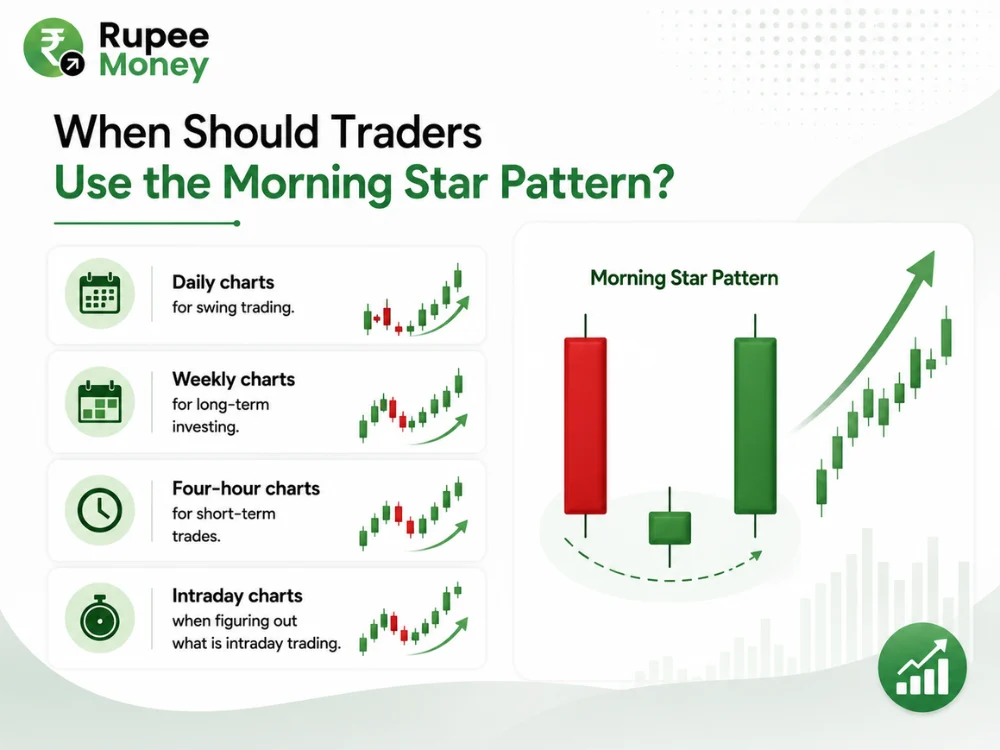
You can spot this pattern across multiple timeframes. Traders use it on:
- Daily charts for swing trading.
- Weekly charts for long-term investing.
- Four-hour charts for short-term trades.
- Intraday charts when figuring out what is intraday trading.
When Is the Pattern Strongest?
Longer timeframes generally produce more reliable signals. A morning star chart on a daily timeframe carries much more weight than one on a 5-minute chart. Intraday charts contain a lot of market noise, which leads to frequent false signals.
You should trade the setup when it appears after a clear downtrend, prints a massive third candle, and aligns with high trading volume.
How Can Beginners Trade the Star Morning Pattern?
Beginners must focus on strict rules rather than trading every pattern they see. Follow this step-by-step process:
- Step 1: Identify the Trend. Confirm the market is actually falling.
- Step 2: Find the Structure. Locate the large red candle, the small middle candle, and the large green candle
- Step 3: Examine the Third Candle. Ensure the green candle closes above the midpoint of the first red candle.
- Step 4: Check Support. Verify the pattern sits on a major support zone.
- Step 5: Look for Confirmation. Wait for high volume or a breakout in the next session.
- Step 6: Manage Risk. Place a strict stop-loss directly below the low of the middle candle. Implementing strict risk management protects your capital if the pattern fails.
What Are the Limitations of the Morning Star Pattern?
No charting pattern boasts a 100% win rate. You must understand the limitations of the star morning chart.
Why Can False Signals Occur?
Sometimes the pattern forms perfectly, but the price immediately crashes lower. This happens when the overarching macroeconomic downtrend remains too aggressive for buyers to overcome.
What Happens During High Volatility?
Sudden news events destroy technical patterns. An unexpected earnings miss or a geopolitical crisis creates extreme stock volatility that will invalidate a perfect morning star candlestick in seconds.
Can It Predict Exact Prices?
Absolutely not. The pattern simply highlights a shift in momentum. It never tells you exactly how far the new uptrend will travel. You must use other tools to set your profit targets.
Where Should You Look for Support With a Morning Star?
Support levels validate the star morning pattern. When the pattern forms at a logical turning point, its success rate skyrockets.
Look for the pattern near:
- Previous swing lows.
- Major historical demand zones.
- Key moving averages (like the 50-day or 200-day MA).
- Rising trendlines.
A morning star chart forming randomly in empty chart space offers a low-probability trade. A pattern forming exactly on the 200-day moving average offers a high-probability trade.
How Can Technical Indicators Help the Morning Star?
Smart traders combine candlestick patterns with technical indicators to build stronger trading strategies.
How Can RSI Help?
The Relative Strength Index (RSI) measures market momentum. If you spot a star morning chart while the RSI sits below 30 (oversold territory), the setup becomes highly attractive. The oversold RSI confirms the market is primed for a bounce.
How Can MACD Help?
The Moving Average Convergence Divergence (MACD) tracks trend direction. If the MACD lines execute a bullish crossover exactly as the morning star forms, you have double confirmation of a new uptrend.
Conclusion
The morning star candlestick remains one of the most trusted bullish reversal patterns in technical analysis. It helps you clearly identify when a falling market runs out of energy.
By tracking the shift from aggressive selling to uncertainty, and finally to aggressive buying, you gain deep insights into market psychology. Remember, the star morning works best when it appears after a clear downtrend and sits directly on a major support level.
Always look beyond the basic shape. Confirm the morning star chart with high trading volume and momentum indicators like the RSI. Most importantly, accept that no pattern is perfect. Use strict risk management, place your stop-loss below the middle candle, and let the market prove your analysis right. Mastering this pattern will undoubtedly elevate your chart-reading skills and trading confidence.
FAQs
What is the morning star candlestick pattern?
It is a three-candle bullish reversal formation. It appears after a downtrend and signals that buyers are taking control from sellers.
What does a morning star mean?
It means the current selling pressure is dying. The market is transitioning from fear to greed, setting up a potential upward rally.
How do you identify a morning star?
You look for a large bearish candle, followed by a small-bodied indecision candle, followed by a large bullish candle that closes deep into the first candle's body.
Why is the morning star considered bullish?
The pattern physically demonstrates buyers overpowering sellers. The massive third green candle proves that bullish momentum has returned to the market.
What is a star morning pattern?
"Star morning" serves as an alternate phrase for the exact same formation. The correct technical term remains the morning star candlestick pattern.
What is a morning star chart?
It is simply a price chart that clearly displays the three-candle morning star formation at the bottom of a downward price move.
Is the morning star a reliable pattern?
Yes, it offers reliable insights, but it is never foolproof. You must combine it with volume analysis, support zones, and strict stop-loss rules to make it an effective trading tool.
Can the morning star be used for intraday trading?
Yes. However, intraday charts generate more false signals. You must use extreme caution and wait for extra confirmation when day trading this pattern.
What is the opposite of a morning star?
The evening star acts as the direct opposite. It appears at the top of an uptrend and warns of a coming price drop.
You look for a large bearish candle, followed by a small-bodied indecision candle, followed by a large bullish candle that closes deep into the first candle’s body.
“Star morning” serves as an alternate phrase for the exact same formation. The correct technical term remains the morning star candlestick pattern.
Disclaimer: Investments in the securities market—including direct stocks, IPOs, mutual funds, hybrid funds, and derivatives (Futures & Options)—are subject to high market risks. Past performance, unofficial Grey Market Premiums (GMP), and quantitative indicators (such as Put-Call Ratios or Max Pain levels) are not reliable indicators of future price movements or guaranteed returns. Options trading, in particular, involves a substantial risk of total capital loss.
ABOUT THE AUTHOR

