
What Is the Put Call Ratio (PCR) and Why Does It Matter for Traders?
Traders use the Put Call Ratio (PCR) to understand options market sentiment. The PCR ratio compares the number of active put options with active call options. Market participants use this data to gauge whether the crowd feels bullish or bearish.
You can calculate the PCR ratio using either open interest (OI) or trading volume. Your choice depends on your specific trading strategy. Index traders frequently track specific metrics like Nifty PCR and the Sensex PCR ratio today. These indicators help them assess live market positioning around India’s benchmark indices.
However, a high or low put call ratio does not guarantee a specific market direction. Smart traders always combine the PCR ratio with price action, implied volatility, and open interest changes. This comprehensive guide explains how you can use this powerful options indicator to improve your daily trading decisions.
What Is the PCR Ratio?
The PCR ratio measures the direct relationship between put options and call options. It gives you a clear snapshot of market positioning.
Traders typically calculate the put call ratio using open interest. Open interest represents the total number of outstanding contracts.
For example, imagine an options market displays the following data:
- Put open interest equals 10 lakh contracts.
- Call open interest equals 8 lakh contracts.
You divide the put open interest by the call open interest.
- PCR = 10 ÷ 8 = 1.25
This calculation tells you that 1.25 put contracts exist for every single call contract.
What Does the Put Call Ratio Tell Traders?
The put call ratio provides a quick snapshot of option positioning. A higher PCR ratio means the market holds more put options than call options. A lower PCR ratio means the market holds more call options than put options.
However, you must interpret these numbers carefully. The true meaning depends heavily on the broader market environment.
How Do Traders Calculate the Put Call Ratio?
Traders use two common versions of the PCR ratio. You must understand both to analyze the market correctly.
How Do You Calculate PCR Using Open Interest?
You calculate this version by dividing total put open interest by total call open interest. This formula helps you understand outstanding positions in the options market.
For example:
- Put Open Interest: 12 lakh contracts
- Call Open Interest: 10 lakh contracts
- PCR Ratio: 1.20
A PCR ratio of 1.20 shows that put open interest sits 20% higher than call open interest. Swing traders strongly prefer this open interest calculation.
How Do You Calculate PCR Using Volume?
You can also calculate the ratio using daily trading volume. You divide the total put trading volume by the total call trading volume.
This volume-based formula measures current intraday activity. It does not measure long-term outstanding positions. Day traders prefer this method to spot sudden intraday shifts.
The two calculations often produce very different results. Therefore, you should always check which data source your PCR ratio uses.
Why Is the PCR Ratio Important for Options Traders?
The put call ratio matters because options markets hide valuable clues. Traders leave footprints when they build large derivative positions.
A stock price only shows the current market value of an asset. Options data reveals what traders expect the asset to do in the future.
Why Do Market Participants Track the Put Call Ratio?
Traders track the PCR ratio for several distinct reasons. They use it to:
- Study overall market sentiment.
- Analyze heavy options positioning.
- Identify potential market extremes.
- Compare put activity against call activity.
- Support specific options selling strategies.
- Monitor sudden position changes around expiry days.
You should never interpret the PCR ratio in isolation. A high put call ratio sometimes signals bullish sentiment. At other times, an extremely high reading reveals excessive market panic. You must always read the surrounding market conditions.
What Does a High PCR Ratio Mean?
A high PCR ratio indicates that put activity exceeds call activity. The market holds a larger volume of puts relative to calls.
For example, a PCR ratio of 1.50 means the market holds 1.5 put options for every call option.
Why Can a High Put Call Ratio Signal Bullish Trends?
You might think a high put call ratio means traders feel bearish. However, professional option sellers write most of these puts. Option sellers usually have deep pockets and better market accuracy.
When traders sell puts aggressively, they expect the market to stay above a certain level. They create strong support zones. Therefore, a high PCR ratio often signals underlying bullish sentiment. This contrarian view explains why beginners should avoid interpreting the PCR ratio mechanically.
What Does a Low PCR Ratio Mean?
A low PCR ratio indicates that call activity exceeds put activity. The market holds fewer puts compared to calls.
For example, a PCR ratio of 0.60 means the market holds only 0.60 put options for every call option.
Why Can a Low Put Call Ratio Signal Bearish Trends?
A massive build-up of call options often creates heavy market resistance. Professional call writers sell these options because they expect the market to stay below a certain price.
When the PCR ratio becomes extremely low, it often highlights excessive retail optimism. The smart money usually fades this optimism. You must examine a low put call ratio alongside price trends, strike prices, implied volatility, and market breadth.
What Is Nifty PCR?
Nifty PCR represents the put call ratio calculated specifically for Nifty 50 options. Nifty options dominate India’s derivative trading volume. Because of this high liquidity, professional traders constantly monitor Nifty put and call open interest.
You can calculate Nifty PCR across different weekly and monthly expiries. You can also calculate it across specific strike price ranges. This variety means you will rarely find one universal Nifty PCR number that applies to every trading scenario.
How Should You Read Nifty PCR During Trading?
Imagine you open your trading terminal and check the Nifty options chain. You notice the following data:
- Traders hold high put open interest at 24,000.
- Traders hold high call open interest at 24,500.
- Nifty currently trades between these two levels.
- The overall Nifty PCR sits above 1.20.
You might interpret this data as evidence of strong put writing. The data suggests 24,000 will act as strong support. However, this Nifty PCR reading does not guarantee safety. Unexpected global news can trigger panic selling. Aggressive institutional activity can destroy this support level in minutes.
What Is the Sensex PCR Ratio Today?
The Sensex PCR ratio today reflects the real-time put call ratio for BSE Sensex options. Sensex options now attract massive trading volume on their expiry days.
Just like the Nifty PCR, you calculate the Sensex PCR ratio today using either open interest or trading volume. The calculation choice depends on your specific data feed.
Why Does the Sensex PCR Ratio Today Change Intraday?
The Sensex PCR ratio today rarely stays static. The number changes constantly throughout the live trading session.
This dynamic movement happens because:
- Traders create aggressive new option positions.
- Traders unwind their losing positions.
- Expiry day speculation causes massive volume spikes.
- Intraday market sentiment shifts rapidly.
- The underlying Sensex index moves across different strike prices.
You must always view the Sensex PCR ratio today with a specific timestamp. A PCR reading from 9:30 AM will look completely different from the reading at 2:30 PM.
How Does the PCR Ratio Help in Identifying Market Sentiment?
Traders use the put call ratio as a primary sentiment indicator. However, reading this sentiment requires skill and experience.
A rising PCR ratio generally highlights stronger put positioning. A falling PCR ratio generally highlights stronger call positioning.
Yet, market participants use options for very different reasons. An institutional fund might buy a put to hedge a massive cash portfolio. A retail trader might buy a put to speculate on a market crash. A professional trader might sell a put to collect premium.
Open interest numbers alone cannot reveal trader intent. You must combine the put call ratio with other data to decode true market sentiment.
When Is the Put Call Ratio Most Useful?
The PCR ratio shines brightest when you combine it with technical analysis. It works best during specific market environments.
When Should Traders Watch PCR Around Expiry?
Options positioning changes violently as the weekly expiry approaches. Day traders watch the PCR ratio to understand how positions develop across key strike prices.
They use the data to spot potential short-covering rallies or long-unwinding crashes. However, expiry day markets experience wild, irrational swings. You should never treat the put call ratio as a guaranteed prediction tool during expiry hours.
When Do Extreme PCR Ratio Readings Matter?
Extremely high or extremely low readings indicate unusual market positioning. Many professional traders use these extreme readings as contrarian signals.
For example, an extremely high put call ratio indicates extreme market fear. When everyone buys protection, selling pressure often exhausts itself. The market often reverses upward from this point.
However, markets can remain irrational for long periods. An extreme PCR ratio can stay extreme while the market continues falling. You absolutely need price action confirmation before taking a contrarian trade.
How Do Traders Combine the Put Call Ratio With Open Interest?
The PCR ratio becomes highly actionable when you analyze individual strike prices.
Imagine Nifty trades exactly at 24,200. You check the data and find:
- The 24,000 Put open interest looks massive.
- The 24,500 Call open interest looks massive.
- The overall PCR ratio sits comfortably above 1.10.
A smart trader will dig deeper. They will check if traders are currently adding or closing positions at the 24,000 strike.
What Does a Change in Open Interest Tell You?
You must watch how open interest changes alongside price action.
- If the price rises and open interest rises, traders are building fresh positions.
- If the price falls and open interest rises, aggressive bears are dominating the market.
You must combine the PCR ratio, strike-level open interest, and option premium prices to determine the true market direction.
What Is the Difference Between the PCR Ratio and Put-Call Open Interest?
Many beginners confuse these two related terms.
Put-call open interest refers to the raw, absolute number of outstanding contracts. The PCR ratio simply converts those two raw numbers into a clean, readable fraction.
For example:
- Put Open Interest equals 20 lakh contracts.
- Call Open Interest equals 10 lakh contracts.
- PCR Ratio equals 2.0 (20 divided by 10).
The ratio format makes it much easier for traders to compare data across different trading days and different expiries.
How Does Open Interest PCR Differ From Volume-Based Put Call Ratio?
You must understand what each calculation actually measures.
Open Interest PCR:
- Uses total outstanding put OI divided by call OI.
- Measures long-term, outstanding positions.
- Changes gradually over the trading week.
- Works best for broad positional analysis.
Volume-Based PCR:
- Uses daily put volume divided by call volume.
- Measures immediate trading activity.
- Changes rapidly minute by minute.
- Works best for fast intraday trading.
Neither version holds superiority over the other. You must choose the specific calculation that aligns with your personal trading style.
Why Should You Never Use the PCR Ratio Alone?
The put call ratio offers great insights, but it carries severe limitations. You will lose money if you trade blindly based on this single indicator.
The PCR Ratio Does Not Show Direction:
A high put call ratio does not force the market to rise. A low put call ratio does not force the market to fall.
The PCR Ratio Hides Trader Intent:
The ratio counts contracts. It does not tell you if smart money bought or sold those options.
The PCR Ratio Changes Quickly:
Aggressive position closures can flip the ratio upside down in a matter of minutes.
Different Expiries Confuse the Data:
Weekly options show different PCR ratios compared to monthly options.
Always combine the PCR ratio with moving averages, support zones, and volume analysis.
How Can Beginners Use Nifty PCR Safely?
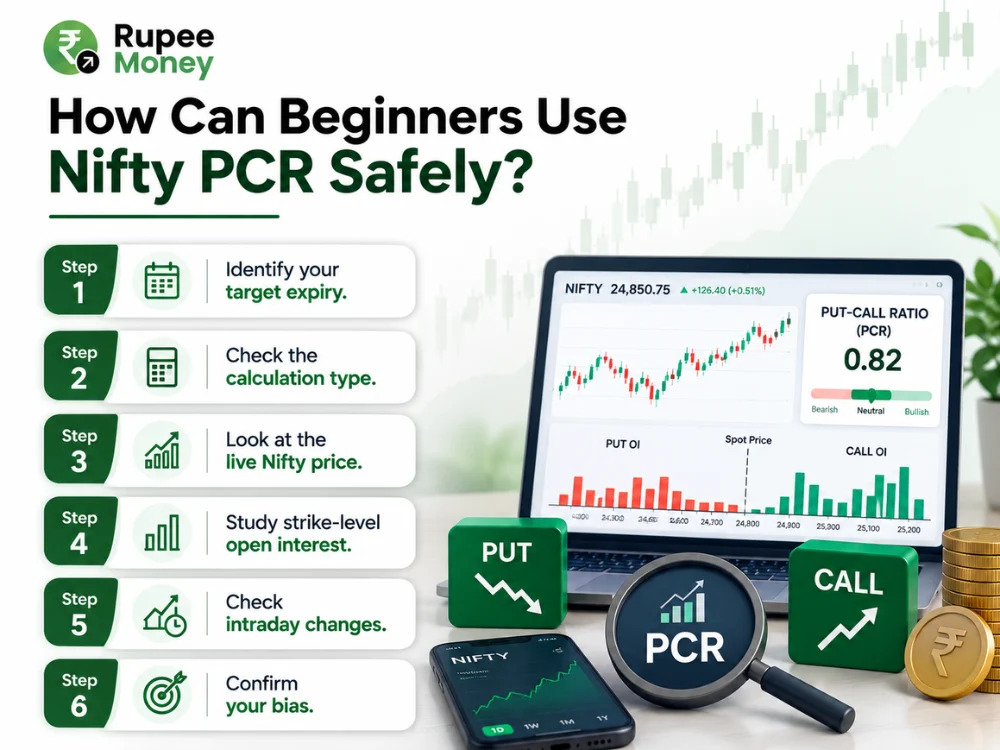
Beginners should use Nifty PCR strictly as an educational tool. Do not take live trades based solely on this number. Follow this simple checklist to understand market positioning:
- Step 1: Identify your target expiry. Decide if you want to analyze the weekly or monthly Nifty PCR.
- Step 2: Check the calculation type. Ensure you know if the data uses volume or open interest.
- Step 3: Look at the live Nifty price. Compare the current PCR ratio with the prevailing market trend.
- Step 4: Study strike-level open interest. Find the strikes with the highest call and put concentrations.
- Step 5: Check intraday changes. Look for sudden fresh additions or panic unwinding.
- Step 6: Confirm your bias. Use chart patterns and price action to validate your options data.
Where Do You Find a Good PCR Ratio?
Traders constantly ask for the “perfect” or “good” PCR ratio. A perfect ratio does not exist.
Generally, a PCR ratio of 1.0 indicates a perfectly balanced market. A PCR ratio above 1.0 indicates strong put positioning. A PCR ratio below 1.0 indicates strong call positioning.
However, you must judge the number based on context. You must consider the specific index, the upcoming expiry, the current market trend, and live implied volatility.
Instead of hunting for a “good” number, ask yourself: “How does today’s put call ratio compare to yesterday’s ratio, and what does price action suggest?”
What Are the Key Limitations of the Put Call Ratio?
You must respect the limitations of the PCR ratio.
First, the ratio treats all market participants equally. It does not separate retail buyers from institutional sellers.
Second, it completely ignores the reasons behind a trade.
Third, large institutional hedging distorts the data. An institution might buy massive put volumes strictly to protect a cash portfolio, not because they expect a crash.
Finally, the underlying Nifty or Sensex reacts to global news, not just derivatives data.
Treat the put call ratio as a supporting piece of evidence. Never treat it as a standalone trading signal.
Conclusion
The put call ratio stands as a crucial indicator for anyone trading the derivatives market. It helps you quickly understand the relative positioning between put and call options.
You can calculate the PCR ratio using open interest or trading volume. Open interest helps you analyze outstanding positions, while volume helps you track intraday momentum. Tracking specific metrics like Nifty PCR helps you understand broader market trends. Monitoring the Sensex PCR ratio today helps you navigate volatile expiry sessions on the BSE.
However, the PCR ratio is not a magical crystal ball. A high PCR ratio does not guarantee a massive market rally. A low PCR ratio does not guarantee a brutal market crash. You must always consider the ratio alongside actual price movement, strike-level open interest, implied volatility, and global market conditions.
The most important lesson remains simple. The put call ratio tells you how options positioning looks right now. It does not tell you exactly where the market will travel tomorrow. Use the PCR ratio as one tool in your analytical toolbox, and always prioritize price action above all else.
FAQs
What is the Put Call Ratio?
The put call ratio compares active put options against active call options. Traders calculate it by dividing put open interest by call open interest.
What does a PCR ratio above 1 mean?
A PCR ratio above 1 means the market holds more put open interest than call open interest. Traders often interpret this as a sign of strong support and potential bullishness.
What does a PCR ratio below 1 mean?
A PCR ratio below 1 means the market holds more call open interest than put open interest. Traders often interpret this as heavy resistance and potential bearishness.
What is Nifty PCR?
Nifty PCR represents the put call ratio calculated specifically from Nifty 50 options data. Traders use it to study positioning around India's benchmark index.
Where do you find the Sensex PCR ratio today?
You find the Sensex PCR ratio today on various broker terminals and analytics platforms. It changes continuously throughout the trading session based on live BSE options data.
Is a high PCR ratio bullish or bearish?
A high PCR ratio requires contextual interpretation. It often reflects aggressive put selling, which indicates bullish support. However, it does not guarantee an upward move.
Is a low PCR ratio bullish or bearish?
A low PCR ratio often indicates heavy call writing. This suggests strong upside resistance and bearish sentiment.
Can the PCR ratio predict the stock market?
No. The PCR ratio cannot reliably predict future market direction. It only highlights current options positioning.
Is the put call ratio useful for options traders?
Yes. The put call ratio provides valuable clues about market sentiment. Smart traders combine it with price action and volatility analysis to make better trading decisions.
Nifty PCR represents the put call ratio calculated specifically from Nifty 50 options data. Traders use it to study positioning around India’s benchmark index.
Disclaimer: The information provided on RupeeMoney is for educational and informational purposes only and does not constitute financial, investment, tax, or legal advice. Stock market and mutual fund investments are subject to market risks. Past performance is not indicative of future results. Always conduct your own research or consult a SEBI-registered financial advisor before making any investment or financial decisions.
ABOUT THE AUTHOR

