Wednesday, October 14, 2026 | 11:02 PM

How Is an IPO Share Price Decided

Professional illustration explaining how an IPO share price is determined using company valuation reports, financial analysis, demand from investors, price band concepts, stock market charts, and investment research graphics.

Many investors apply for an IPO hoping to earn listing gains or become early shareholders. One question keeps coming up, though. How does a company actually decide its IPO share price? It’s not a random figure picked overnight. Several financial, business, and market factors shape the final price. Do you follow IPO news on RupeeMoney? … Read more


What Makes the Stock Market Go Up or Down?

Illustration showing the major factors that influence stock price movements, including economic conditions, interest rates, global events, market sentiment, oil prices, and company performance with financial charts and trading indicators.

What makes the stock market go up or down is a question every new investor asks eventually. The market rarely moves without a reason, some days it rises sharply, other days it falls despite seemingly good news. The real answer is a mix of business performance, economic conditions, investor behaviour, and market expectations, all pulling … Read more

Why Do FIIs and DIIs Affect the Indian Stock Market? A Complete Guide for Investors

Illustration comparing Foreign Institutional Investors (FIIs) and Domestic Institutional Investors (DIIs) using global and Indian investment symbols, stock market charts, growth indicators, and financial assets to explain institutional investing.

One day the Indian stock market rallies sharply, and the next it falls despite no major news breaking. Plenty of investors wonder what’s driving such sudden swings, and in many cases, the answer traces back to the buying and selling activity of Foreign Institutional Investors (FIIs) and Domestic Institutional Investors (DIIs). Every trading day, investors … Read more

What Is the Sensex and How IS Calculated?

Illustration explaining the Sensex with a stock exchange building, rising market chart, investment graphs, and financial symbols representing the performance of India's leading listed companies.

The Indian stock market moves every business day, and one number tends to dominate the financial headlines — the Sensex. When you hear “the market gained 500 points” or “fell by 800 points,” people are usually talking about this exact figure. But what does that number actually represent, and why do investors, analysts, and businesses … Read more

What Are Upper Circuit and Lower Circuit in the Share Market? A Beginner’s Guide

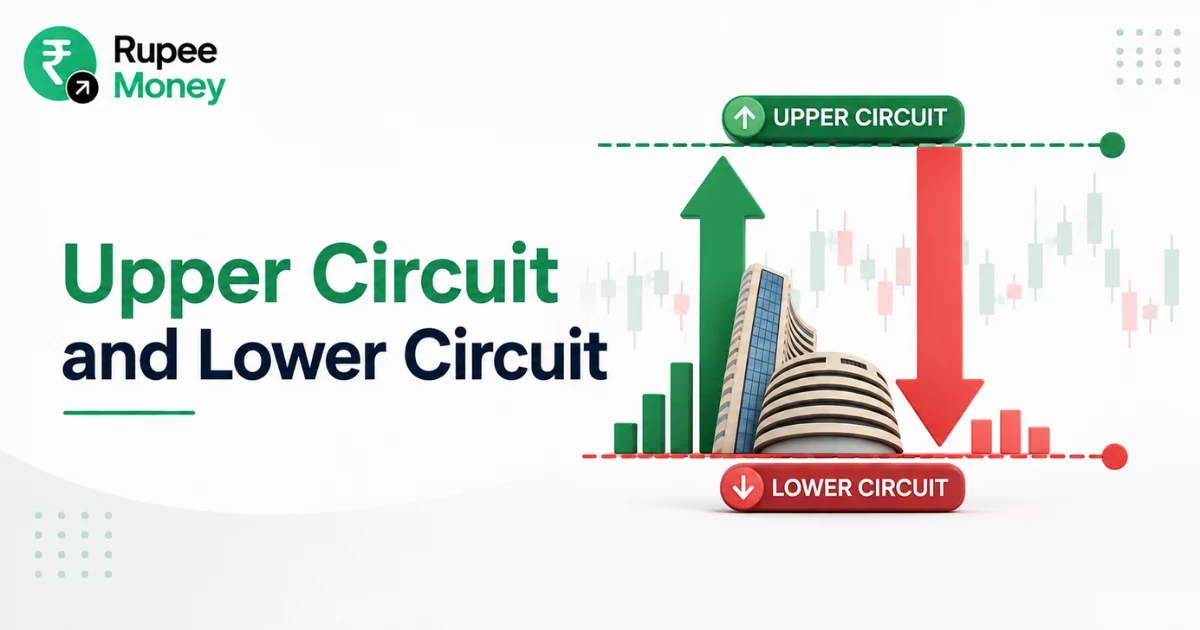
Illustration explaining upper circuit and lower circuit in the stock market with upward and downward price limit indicators, stock exchange building, market charts, and trading symbols representing daily price movement limits.

Ever noticed a stock jump 10% or crash 10% in a single day and then just… stop moving? You’ve probably also seen headlines saying a stock “hit the Upper Circuit” or “hit the Lower Circuit.” Plenty of new investors assume trading has frozen due to some technical glitch, but these limits actually exist to protect … Read more