
Historical Gold Rates in India: Price Trends from 1992 to 2026

Gold occupies an irreplaceable position in the Indian financial and cultural landscape. Beyond its deep-rooted significance in weddings and festivals, the precious metal serves as a resilient financial shield against inflation, currency depreciation, and global economic turbulence. For modern investors, analyzing the historical gold rates in India offers crucial insights into how wealth preservation works across various macroeconomic cycles.
A retrospective look at the bullion market reveals a staggering journey of wealth accumulation. Based on historical datasets, the financial-year average for 24-karat (24K) gold skyrocketed from a modest ₹4,103.66 per 10 grams in FY1992-93 to a phenomenal ₹1,46,160.00 in FY2025-26. This translates to a massive 35x multiplication of invested capital. However, this ascent was punctuated by severe market corrections, proving that while gold is a phenomenal long-term asset, it is not immune to short-term volatility.
Whether you are evaluating your family’s generational wealth or incorporating precious metals into your modern financial planning strategy, understanding this 34-year pricing trajectory is essential.
(Important Note: The historical pricing data outlined in this analysis represents the financial-year annual averages for pure 24K gold per 10 grams. These are core wholesale bullion rates and do not reflect the final retail jewelry prices, which heavily factor in GST, material wastage, and labor-intensive making charges.)
Year-Wise Gold Price History in India (FY1992 to FY2026)
The table below meticulously tracks the average financial year (April to March) prices of 24K gold per 10 grams.
| Financial Year | 24K Gold Price (₹/10g) | YoY Change |
| 1992-93 | ₹4,103.66 | -4.5% |
| 1993-94 | ₹4,531.87 | +10.4% |
| 1994-95 | ₹4,667.24 | +3.0% |
| 1995-96 | ₹4,957.60 | +6.2% |
| 1996-97 | ₹5,070.71 | +2.3% |
| 1997-98 | ₹4,347.07 | -14.3% |
| 1998-99 | ₹4,268.17 | -1.8% |
| 1999-00 | ₹4,393.56 | +2.9% |
| 2000-01 | ₹4,473.60 | +1.8% |
| 2001-02 | ₹4,579.12 | +2.4% |
| 2002-03 | ₹5,332.36 | +16.4% |
| 2003-04 | ₹5,718.95 | +7.2% |
| 2004-05 | ₹6,145.38 | +7.5% |
| 2005-06 | ₹6,900.56 | +12.3% |
| 2006-07 | ₹9,240.32 | +33.9% |
| 2007-08 | ₹9,995.62 | +8.2% |
| 2008-09 | ₹12,889.74 | +29.0% |
| 2009-10 | ₹15,756.09 | +22.2% |
| 2010-11 | ₹19,227.08 | +22.0% |
| 2011-12 | ₹25,722.42 | +33.8% |
| 2012-13 | ₹30,163.93 | +17.3% |
| 2013-14 | ₹29,190.39 | -3.2% |
| 2014-15 | ₹27,414.55 | -6.1% |
| 2015-16 | ₹26,534.26 | -3.2% |
| 2016-17 | ₹29,665.28 | +11.8% |
| 2017-18 | ₹29,300.08 | -1.2% |
| 2018-19 | ₹31,193.41 | +6.5% |
| 2019-20 | ₹37,017.91 | +18.7% |
| 2020-21 | ₹48,723.22 | +31.6% |
| 2021-22 | ₹47,999.25 | -1.5% |
| 2022-23 | ₹52,730.77 | +9.9% |
| 2023-24 | ₹60,623.95 | +15.0% |
| 2024-25 | ₹75,841.87 | +25.1% |
| 2025-26 | ₹1,46,160.00 | +92.7% |
| 2026-27 (YTD) | ₹1,45,690.00 | -0.3% |
(Data Source Note: Values reflect historical financial-year averages. The FY2026-27 figure represents partial-year data up to June 11, 2026, and should not be misconstrued as a finalized annual average.)
Decade-by-Decade Market Analysis
1992 to 2000: Post-Liberalization Volatility
The 1990s initiated with India opening its economy to global markets. During FY1992-93, the base average for gold sat at ₹4,103.66 per 10 grams. While the asset steadily climbed to breach the ₹5,000 threshold by FY1996-97, the momentum was short-lived. The ripple effects of the Asian Financial Crisis triggered a severe global commodity crash, wiping out 14.3% of gold’s value in India during FY1997-98, dropping the rate to ₹4,347.07. This era serves as a stark reminder that prolonged periods of flat or negative returns are entirely possible in the precious metals market.
2000 to 2010: The Unstoppable Bull Run
The turn of the millennium marked the beginning of an aggressive, historic surge. From a starting point of ₹4,473.60 in FY2000-01, gold nearly doubled by FY2006-07 (₹9,240.32). The definitive catalyst, however, was the 2008 Global Financial Crisis. As international banking systems collapsed, terrified global investors hoarded safe-haven assets. Consequently, Indian gold rates skyrocketed by 29% in FY2008-09, hitting ₹12,889.74, and closed the decade at a commanding ₹15,756.09 in FY2009-10.
2010 to 2020: Market Peaks and Consolidation
The momentum born from the financial crisis spilled violently into the 2010s. FY2011-12 witnessed a massive 33.8% annual jump, pushing the metal past the ₹25,000 mark. By FY2012-13, the asset crossed ₹30,000 per 10 grams.
However, as the US economy stabilized and interest rate hikes loomed, gold entered a vicious multi-year bear market. Prices steadily eroded for three consecutive financial years (FY2013-14 to FY2015-16), plunging back to ₹26,534.26. It wasn’t until late in the decade, fueled by renewed inflation fears, that gold recovered to log ₹37,017.91 in FY2019-20.
2020 to 2026: Pandemics, Inflation, and Historic Highs
The 2020s fundamentally rewrote the record books. The COVID-19 pandemic triggered a 31.6% explosion in FY2020-21, pushing the metal to ₹48,723.22. Following a brief consolidation in FY2022, relentless central bank hoarding, domestic currency fluctuations, and geopolitical wars drove aggressive accumulation.
This culminated in an unprecedented 92.7% leap in FY2025-26, driving the average price to an astonishing ₹1,46,160.00 per 10 grams. As of mid-2026, the partial-year data holds steady near ₹1.45 lakh, cementing gold’s status as a high-performing wealth compounder over the current decade. Measuring this kind of exponential growth requires advanced perspective, much like utilizing a lumpsum calculator to project multi-decade equity returns.
Primary Drivers Behind India’s Gold Price Trends
Understanding the macroeconomic forces that dictate bullion pricing is critical for strategic asset allocation.
- International Spot Prices: India imports virtually its entire gold supply. Therefore, global benchmarks established by the COMEX exchange and the London Bullion Market Association (LBMA) directly dictate baseline domestic costs.
- The INR to USD Exchange Rate: Because international gold is priced in US Dollars, the Rupee-Dollar exchange rate plays an outsized role. If the Rupee depreciates against the Dollar, imported gold automatically becomes more expensive for Indian consumers, even if global gold prices remain static.
- Inflationary Pressures: As the cost of living rises and fiat currency loses purchasing power, retail and institutional investors flock to gold, viewing it as a tangible store of value.
- Central Bank Accumulation: Global central banks (including the RBI) physically stockpile gold to diversify their foreign exchange reserves. Massive institutional buying physically removes supply from the open market, forcing spot prices upward.
- Interest Rate Cycles: Gold yields zero passive interest. When central banks hike interest rates to combat inflation, risk-free bank deposits become attractive, often pressuring gold prices downward. Conversely, rate cuts typically trigger gold rallies.
Bullion Market Rates vs. Retail Jewelry Invoices
A common source of confusion among retail consumers is the glaring discrepancy between historical market rates and actual showroom bills.
The historical data tracked in financial charts references pure 24-karat (24K) raw bullion. However, 24K gold is inherently too soft to mold into durable daily-wear jewelry. Retailers must alloy it with other metals (like zinc or copper) to create 22K or 18K structural gold.
When you purchase a necklace or a ring, you never pay the raw spot price. The final retail invoice incorporates the base 22K gold rate, hefty making charges (labor), material wastage percentages, and the mandatory 3% Goods and Services Tax (GST).
Modern Avenues for Precious Metal Allocations
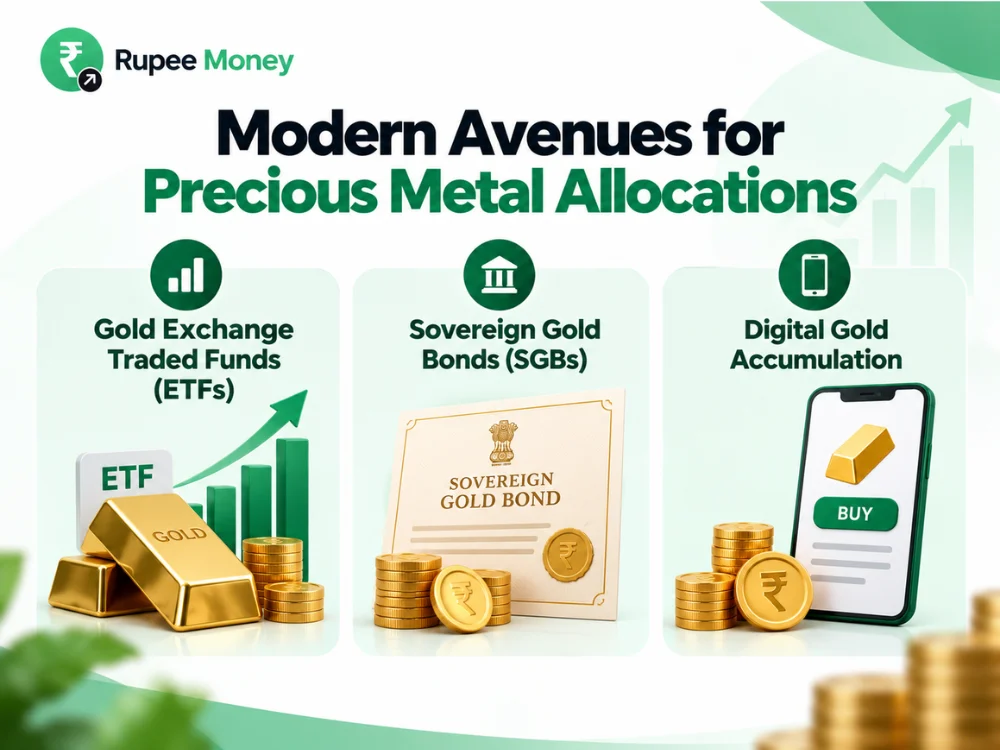
As we navigate the contemporary financial landscape in 2026, modern investors no longer need to rent expensive bank lockers to secure their wealth. The financial ecosystem offers several highly efficient alternatives to physical jewelry.
Gold Exchange Traded Funds (ETFs)
Gold ETFs trade directly on the stock exchanges exactly like standard corporate shares. Each ETF unit typically represents one gram of high-purity physical gold securely vaulted by the issuing mutual fund house. This vehicle provides exceptional liquidity, allowing you to buy and sell at transparent market rates without suffering retail making charges.
Sovereign Gold Bonds (SGBs)
The Reserve Bank of India issues these government-backed securities. SGBs eliminate all physical storage risks and track the domestic bullion price accurately. Uniquely, SGBs pay a supplementary fixed annual interest rate on your initial investment amount, generating passive income while you wait for the underlying asset to appreciate.
Digital Gold Accumulation
Fintech platforms now permit retail users to accumulate fractional quantities of 24K gold digitally. While highly convenient for micro-investing, investors must carefully scrutinize the platform’s storage fees, spread margins, and regulatory backing before committing substantial capital.
Conclusion
The evolution of historical gold rates in India from 1992 to 2016 perfectly illustrates the dual nature of precious metals. The asset generated a massive 713% nominal return growing from ₹4,334 to ₹35,220 per 10 grams proving its exceptional capability to preserve purchasing power across decades.
However, this timeline also debunks the myth that gold prices exclusively rise. Investors who purchased near the 1996 or 2012 peaks endured agonizing, multi-year waits just to break even. Ultimately, gold remains a highly effective portfolio diversifier and a brilliant hedge against currency devaluation, but it requires a disciplined, long-term investment horizon to extract maximum financial utility.
FAQs
What was the gold price in India in 1992?
According to standard historical bullion data, the average price for 24-karat gold in 1992 stood at approximately ₹4,334 per 10 grams. This era marked the immediate aftermath of India's historic economic liberalization reforms.
How much did the gold price increase from 1992 to 2019?
The average 24K gold rate climbed from roughly ₹4,334 per 10 grams in 1992 to ₹35,220 per 10 grams in 2019. This massive expansion represents a nominal price increase of approximately 713% over the 27-year observation window.
Why did gold prices crash between 2013 and 2015?
Following a historic peak in 2012, global macroeconomic fears began to subside. As the United States economy displayed strong recovery metrics and the Federal Reserve signaled impending interest rate hikes, institutional investors liquidated their safe-haven gold positions to purchase higher-yielding equity and debt assets, triggering a three-year price erosion.
What is the difference between 24K bullion rates and retail 22K jewelry prices?
Financial historical charts display 24K raw bullion rates. Retail showrooms sell 22K or 18K gold because pure 24K gold lacks the structural rigidity necessary for jewelry. Furthermore, retail invoices heavily inflate the final cost by adding intricate making charges, material wastage fees, and mandatory government taxation (GST).
How does the US Dollar exchange rate affect Indian gold prices?
Because the international market prices raw gold strictly in US Dollars, the INR/USD exchange rate actively manipulates domestic pricing. If the international dollar price of gold remains completely static, but the Indian Rupee loses value against the Dollar, it costs more Rupees to import the exact same quantity of metal, forcing the domestic price higher.
According to standard historical bullion data, the average price for 24-karat gold in 1992 stood at approximately ₹4,334 per 10 grams. This era marked the immediate aftermath of India’s historic economic liberalization reforms.
Disclaimer: The historical price data, economic analysis, and investment methodologies presented in this article are compiled strictly for educational and informational awareness. RupeeMoney does not operate as a SEBI-registered Investment Adviser. Historical performance and past price trends never guarantee future financial returns. Pricing datasets utilize annual averages and may differ slightly based on specific trading markets and calculation methodologies. Always evaluate your personal risk tolerance and consult a certified financial planner before executing any capital investments.
ABOUT THE AUTHOR

