
How Do Company Results Affect Share Prices? Corporate Earnings, EPS & Stock Valuation

Ever wondered why a company’s share price jumps after one quarterly result and tanks after another? The answer usually comes down to the company’s financial performance and what investors expected. Every quarter, listed companies release their corporate earnings, offering insights into their revenue, profits, expenses, and overall business performance, along with their future direction.
At RupeeMoney, we think understanding company results ranks among the most valuable skills any stock market investor can build. You don’t need a finance degree to read an earnings report — once you grasp terms like net income, Earnings Per Share (EPS), the P/E ratio, and the cash flow statement, you can make far better decisions. If you’re still building your investing foundation, our guide on what SIP is and how it works is a solid place to start alongside this one.
This article covers how company results move share prices, why some stocks rise despite lower profits, and which numbers actually deserve your attention before you invest.
What Are Corporate Earnings?
Corporate earnings refer to the profits a company generates during a specific period, like a quarter or a full financial year. Listed companies in India publish their financial results every quarter, following the regulations set by the stock exchanges.
An earnings report tells you about:
- Revenue generated during the period
- Operating expenses
- Profit before tax
- Net income
- Earnings Per Share (EPS)
- Future business outlook
Investors compare these numbers against previous quarters and market expectations. Strong earnings usually lift investor confidence, while disappointing results can dampen demand for the stock.
How Company Results Affect Share Prices
Stock prices change as investors continuously evaluate a company’s future growth potential. Quarterly earnings provide fresh financial information, making them one of the key factors influencing share prices.
Better Earnings Build Investor Confidence
When a company reports higher revenue and stronger net income, investors usually expect the growth to continue. Higher profits suggest efficient operations and healthy cash flow, and as more people buy the stock, demand rises — often pushing the price up.If a company reports a 25% increase in quarterly profits when the market was expecting only 15% growth, it often attracts strong buying interest from investors.
Weak Earnings Can Drag Prices Down
A company might report falling sales, thinner profits, or rising costs, and these weak numbers can shake confidence since they may signal slowing growth. When investors expect earnings to keep declining, many start selling, pushing the price lower. Still, not every weak quarter triggers a major drop — investors also weigh whether the decline looks temporary or points to a deeper problem.
Expectations Matter More Than Actual Numbers
Here’s an important lesson: stock prices react to expectations, not just raw profits. Say analysts expect a company to earn ₹20 per share. Report ₹24, and investors may see that as excellent news. But if analysts expected ₹30 and the company delivers ₹24, investors may view that as disappointing — even though profits actually grew year-on-year. This is exactly why share prices sometimes fall despite higher profits.
What’s Inside an Earnings Report?
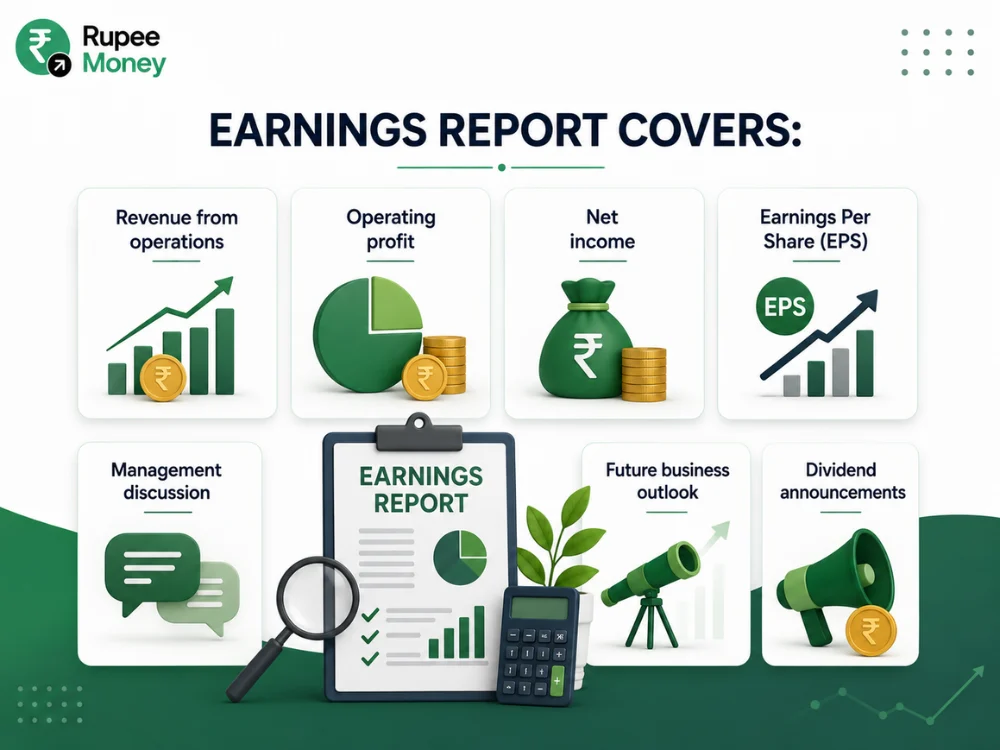
An earnings report gives you a detailed summary of a company’s financial performance for a specific period. Companies listed on the NSE and BSE publish these reports quarterly and annually, and investors study them carefully since they reveal both financial health and future direction.
A typical earnings report covers:
- Revenue from operations
- Operating profit
- Net income
- Earnings Per Share (EPS)
- Management discussion
- Future business outlook
- Dividend announcements, if any
Institutional investors, mutual funds, and analysts often dig into these reports the moment they release, since even small surprises can move stock prices.
Income Statement, Balance Sheet, and Cash Flow Statement
Real financial analysis needs more than checking profits alone — investors typically study three statements together.
Income Statement
The income statement shows what the company earned and spent during a period, covering total revenue, operating expenses, interest, taxes, and net income. It helps you gauge whether the company is consistently improving its profitability.
Balance Sheet
The balance sheet gives you a snapshot of the company’s financial position — total assets, total liabilities, shareholders’ equity, borrowings, and cash reserves. A strong balance sheet usually means the company can weather economic slowdowns more comfortably than one carrying excessive debt, so compare debt levels against profits before investing.
Cash Flow Statement
Many beginners focus only on profits, but profits alone can’t tell you whether a company actually generates cash.The cash flow statement shows how cash moves into and out of the business through its operating, investing, and financing activities. Positive operating cash flow generally signals a business generates enough cash from its regular operations, and companies with healthy cash flow usually have more room for expansion, debt repayment, and dividends.
Net Income and Why It Matters
Net income is the company’s final profit after deducting all operating expenses, taxes, and interest costs — often called the “bottom line” since it sits at the end of the income statement. Investors track it closely because it reflects profitability directly.
That said, experienced investors never rely on this number alone. They also check revenue growth, operating margins, cash flow, debt levels, and future guidance. A company’s net income may appear unusually high in a particular quarter because of a one-time asset sale, but such gains do not necessarily reflect long-term business performance or sustainable growth.
Earnings Per Share (EPS) and Why It Matters
Earnings Per Share measures how much profit a company earns for each outstanding share, and it ranks among the most widely used ratios in stock valuation.
EPS = Net Income ÷ Total Outstanding Shares
For example, if net income comes to ₹500 crore and outstanding shares total 100 crore, EPS works out to ₹5 per share.
A rising EPS often points to improving profitability and better returns for shareholders, but you should compare EPS growth across multiple quarters rather than judging it off a single reporting period — and always compare it against similar companies in the same industry, since profit margins vary widely across sectors. Many analysts treat consistent EPS growth as a positive sign, since it often reflects healthy business expansion and efficient management.
Price-to-Earnings (P/E) Ratio and Stock Valuation
The P/E ratio ranks among the most commonly used valuation tools in the stock market, helping you judge whether a stock trades at a reasonable price relative to its earnings.
P/E Ratio = Current Share Price ÷ EPS
For example, if the share price sits at ₹800 and EPS comes to ₹40, the P/E ratio works out to 20 — meaning investors are willing to pay ₹20 for every ₹1 of the company’s earnings.
A higher P/E often suggests investors expect stronger future growth, while a lower P/E may point to an undervalued stock or slower expected growth. Always compare the P/E ratio against companies in the same sector, since valuation levels differ across industries. Metrics like Return on Assets (ROA) can add another layer to this analysis by showing how efficiently a company actually uses its assets to generate profit.
Earnings Yield and Investment Analysis
It flips the P/E ratio around, showing how much profit a company generates relative to its current share price.
Earnings Yield = (EPS ÷ Current Share Price) × 100
If EPS is ₹20 and the share price is ₹400, the earnings yield comes to 5%. Investors often compare this figure against fixed-income returns, government securities, and other investment options. A higher earnings yield can suggest better value, but you should still weigh growth prospects, business quality, and financial strength before deciding.
Forward Guidance and Future Share Prices
Company management doesn’t just report past performance — it also shares expectations for coming quarters through forward guidance, which can include expected revenue growth, planned expansion, capital expenditure, new product launches, industry outlook, and profit margin expectations.
Sometimes a company posts excellent quarterly results but gives weak guidance for the future, and investors turn cautious even though current earnings look strong — often sending the share price down anyway. On the flip side, a company might report average profits but offer optimistic guidance, and investors respond positively, pushing the price up. If you’re weighing whether a company’s growth story extends to going public through an IPO, forward guidance from listed peers in the same sector can offer useful context too. All this shows the stock market cares as much about future earnings as it does about current performance.
Earnings Season and Market Volatility
The stretch when most listed companies announce quarterly results is known as earnings season. In India, companies generally report every quarter after their reporting period ends.
During earnings season, stock prices tend to get more volatile, trading volumes rise, institutional investors actively review performance, analysts revise their target prices, and everyone compares results against expectations. Companies that deliver consistent earnings growth tend to attract long-term investors, while businesses that repeatedly miss expectations often see increased selling pressure.
Why Good Results Sometimes Fail to Lift Share Prices
Many beginners assume good results always push stock prices higher, but several factors can get in the way:
- High expectations already priced in: if investors already expected excellent results, the market may have adjusted the price before the announcement even landed.
- Weak forward guidance: cautious management commentary about the future can dent confidence even after a strong quarter.
- Expensive valuation: a stock trading at a very high P/E already reflects optimistic expectations, so investors may book profits even after good news.
- Sector-wide challenges: strong individual performance can’t always offset negative industry trends, like rising raw material costs or new regulations.
- Overall market sentiment: global events, interest rate changes, inflation, or geopolitical developments can outweigh positive company earnings entirely.
How Investors Should Read Company Results
Rather than fixating on one number, look at the complete financial picture before you invest. Review revenue growth over multiple quarters, the net income trend, EPS, operating margins, debt levels, cash flow from operations, return ratios, dividend history, management’s forward guidance, industry outlook, and stock valuation using the P/E ratio.
A genuinely long-term investment decision weighs both financial performance and business quality together. If you’d rather let a fund manager handle this analysis for you, our guide to large-cap mutual funds is worth exploring, and you can estimate potential growth from a one-time investment using our Lumpsum Calculator.
Key Takeaways
- Company results provide valuable insight, but you shouldn’t decide based on quarterly profits alone.
- Strong earnings, rising EPS, healthy cash flow, and realistic valuations often signal a fundamentally strong company.
- Future growth prospects, industry conditions, and market expectations all shape stock prices too.
- Successful investors study the complete earnings report, track performance over time, and focus on long-term growth rather than reacting to short-term moves. Building that discipline early matters — our guide on building wealth in your 20s covers how to set that foundation. You can also project your own long-term growth using our SIP Calculator.
Frequently Asked Questions
What are corporate earnings?
Corporate earnings refer to the profits a company generates in a specific period, appearing in the quarterly and annual reports listed companies publish. Investors study these to evaluate performance, profitability, and future growth. Strong earnings generally boost confidence, while weaker results can hurt stock prices.
What is Earnings Per Share (EPS)?
EPS reflects the profit allocated to every outstanding share held by shareholders. Investors use it to compare profitability across companies and track earnings growth over time. A consistently rising EPS often reflects improving performance, but weigh cash flow, debt, and future growth too before investing.
Why does a share price fall even after good results?
A stock can fall despite strong earnings if the market already expects even better performance. Stock prices can also be affected by weak future guidance, high valuations, profit booking, or negative market sentiment, as investors usually focus more on future prospects than past results.
What is the P/E ratio, and why does it matter?
The P/E ratio compares a company’s current share price with its EPS, helping you judge whether a stock looks reasonably valued relative to earnings. A higher P/E can suggest strong growth expectations; a lower one might point to an undervalued stock or weaker expected growth. Always compare P/E ratios within the same industry.
Which financial statement should investors read first?
Most start with the income statement since it covers revenue, expenses, and net income. However, looking at this metric alone doesn’t provide the complete picture. Combine it with the balance sheet to assess financial strength and the cash flow statement to understand how effectively the company generates cash.
What is forward guidance in an earnings report?
. Forward guidance refers to management’s expectations for future performance — projected revenue, profitability, expansion plans, or anticipated challenges. Investors watch it closely since future growth expectations often move share prices more than historical results.
Conclusion
Company results play a major role in shaping stock prices, but they’re only one part of the investing puzzle. Evaluate corporate earnings, net income, EPS, cash flow, and stock valuation together rather than leaning on a single metric. Understanding earnings reports helps you make informed decisions and avoid emotional reactions during earnings season — and pairing that discipline with a genuinely long-term, diversified approach, including instruments like government securities, can improve your investment outcomes over time.
Disclaimer: This article is for educational and informational purposes only. Futures and Options trading involves substantial market risk and may not suit every investor. Nothing here should be considered investment, legal, or tax advice. Exchange rules, margin requirements, and SEBI regulations may change over time, so always do your own research or consult a qualified financial advisor before trading derivatives.
ABOUT THE AUTHOR

